$ cat research/dengue-forecasting/case-study.md
Dengue Outbreak Forecasting Dataset & Model
A monthly 2015–2024 dataset for SOCCSKSARGEN, assembled and reconciled from three incompatible source types, and the forecasting model built on it. First author of four. Published in IJLTEMAS.
IJLTEMAS Vol. XV Issue VI · DOI: 10.51583/IJLTEMAS.2026.150600192
# 01 / problem
The data existed. It just wasn’t one dataset.
Forecasting dengue outbreaks in SOCCSKSARGEN needs case counts, climate, and geography in the same table. Those three things live in three different institutions, in three formats that do not agree on units, resolution, or place names: DOH-CHD SOCCSKSARGEN surveillance records, Google Earth Engine rasters, and NAMRIA shapefiles.
Before any modelling could start, someone had to sit with all three and reconcile them — and then be able to say, for every value in the result, where it came from.
Regional health planning: the people who decide where vector control goes and when. A forecast is only useful to them if the inputs are auditable and the failure modes are stated.
# 02 / constraints and tradeoffs
What the sources allowed, and what they cost
Three institutions, three formats
Tabular case records, raster climate data, and vector boundaries had to be reconciled before they could sit in one row together.
Monthly resolution, not weekly
Monthly is the resolution every source could support consistently across ten years. Weekly would have meant gaps, and gaps get filled with assumptions.
Completeness checked first
Completeness and consistency were verified before any pre-modelling method ran. Cleaning a dataset you have not audited hides the problem instead of fixing it.
Report the misses, not only the wins
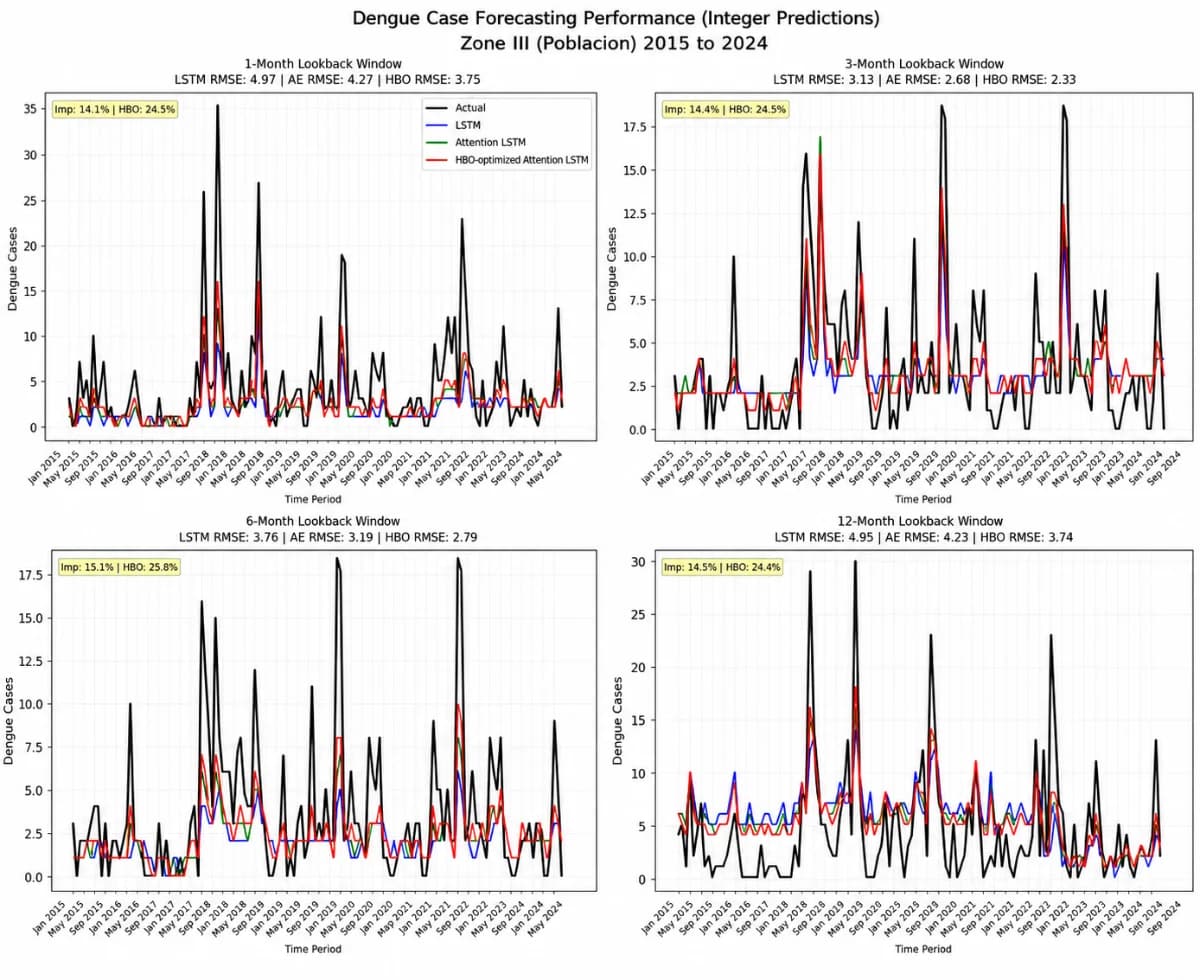
The model still underpredicts extreme spikes. That is in the paper, next to the results, because a planner needs to know where the forecast is weakest.
# 03 / data flow
From three sources to one table
Surveillance records came from the regional health office, climate variables from DOST PAG-ASA and Earth Engine, boundaries from NAMRIA. Each stream was checked on its own, then joined on municipality and month, then checked again as a whole before modelling.
# 04 / figures
Three views worth showing
# 05 / results
What came out of it
| Output | Detail |
|---|---|
| Dataset | 2,918 rows × 19 columns, monthly, 2015–2024, with a data dictionary |
| Sources reconciled | DOH-CHD SOCCSKSARGEN, DOST PAG-ASA, Google Earth Engine, NAMRIA |
| Publication | IJLTEMAS Vol. XV Issue VI — first author of four |
| Stated limitation | Remaining underprediction of extreme spikes, reported alongside results |
| My role | Sourcing, reconciliation, completeness and consistency checks, first-author write-up |
# 06 / lessons
Lessons learned
- Most of the work was reconciliation, not modelling. The dataset was the contribution; the model was what proved it was usable.
- Check completeness before you clean. Every pre-modelling method assumes something about the gaps, so you need to know what the gaps are first.
- Write the data dictionary as you go. Reconstructing what a column meant six months later is worse than documenting it the day you made it.
- Reporting the underprediction made the paper more useful, not weaker. A stated failure mode is something a planner can work around.
Got a dataset nobody trusts yet?
Research, reconciliation, verification, and the writing that explains it.